Fed Stability Report: Hedge Fund Leverage at a Record, Term Premiums Up, and Yields Higher Since
The Fed's November Financial Stability Report uses data to 28 October. Treasury yields have moved further since, and hedge fund leverage is the highest on record.
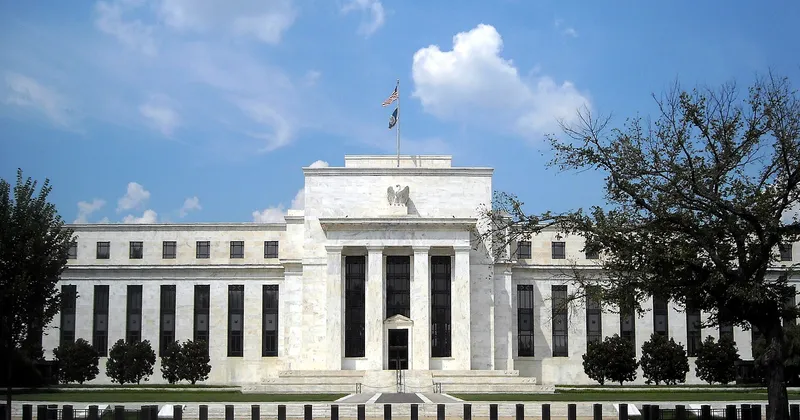
The Federal Reserve Board published its twice-yearly Financial Stability Report on 13 November. It is a document about vulnerabilities, not forecasts, and it carries a date stamp that matters this month: the report “generally reflects information that was available as of October 28, 2026”. The markets it describes have kept moving since.
What the Fed says is stretched
The overview sorts vulnerabilities into four boxes, and the first and third are the ones with the sharpest language.
Valuations remain elevated. The Fed says equity valuation measures stayed high, “partly driven by market enthusiasm for super intelligence”, the report’s label for the AI investment theme. The forward price-to-earnings ratio of the S&P 500 is well above its historical median, even though higher earnings expectations have pushed it down over the past year. A measure of the equity premium, which compares the forward earnings yield with the real 10-year Treasury yield, sits near the lower end of its historical range. In plain terms, investors are not being paid much extra for holding stocks instead of safe bonds.
The report’s table of asset markets gives a sense of scale. Public equities were valued at $93.6 trillion in the second quarter of 2026, up 25.3% over twelve months. Treasury securities stood at $30.9 trillion, up 8.3%.
Term premiums rose. The Fed’s model-based estimate of the Treasury term premium, the extra return investors require to hold longer-dated bonds instead of rolling short ones, rose “notably” above its historical median. Interest-rate volatility implied by swaptions moved above its median in September and October. Corporate bond spreads stayed at the low end of their history, though high-yield spreads rose moderately.
Hedge fund leverage is the highest since the data began. The report says leverage reached its highest level since 2013, the first year with comprehensive data, “reflecting record or near-record leverage” in equity, relative value and macro strategies. That happened despite a decline in the so-called basis trade, a strategy that exploits small gaps between Treasury futures and bonds. The Fed adds that the leverage is concentrated in a small number of large funds, and that it supports trades involving Treasuries, interest rate derivatives and equities. Leverage at the largest life insurers also stayed historically high.
Not everything is flagged. Banks are described as sound and resilient with high capital ratios, though fair value losses on fixed-rate assets remain sizable. Household debt relative to GDP is below its median, and broker-dealer leverage is low.
What happened to yields after the cutoff
The Treasury publishes daily par yields, and they make the date stamp concrete. On 28 October, the last day the report’s data covered, the 10-year yield was 5.05%, the 2-year 4.67% and the 30-year 5.37%. By the close on 13 November, the day the report appeared, they were 5.15%, 4.88% and 5.47%. The 2-year moved the most, up 21 basis points in sixteen days, which fits a market that has been pricing in more Fed tightening.
The path was not smooth. The 10-year slipped to 4.94% on 30 October, stayed between 4.84% and 4.95% in the first nine days of November, and then climbed through 4.98% on 10 November and 5.10% on 12 November. For comparison, the 10-year was 5.31% on 5 October, so the latest reading is below early October’s peak and above last month’s low.
That context matters for two of the Fed’s themes. The report links higher Treasury yields to its valuation worry, since stock valuations are measured against bond yields. And it notes that fair value losses on banks’ fixed-rate assets are “sensitive to changes in long-term interest rates”, so each further rise matters more than the last. This article cannot recalculate the Fed’s equity premium measure with newer yields, because it depends on forward earnings and a real-yield estimate that are not in these sources. The direction, though, is not in doubt: bond yields rose and the cushion in the measure did not widen on that account.
The risks market contacts named
The Fed’s survey of salient risks, run in September and October, asked market participants what worried them. The most frequently cited were risks from artificial intelligence, a correction in risk assets, higher long-term interest rates, cyberattacks, and the sustainability of fiscal debt. One of the five, higher long-term rates, is what the Treasury data show happening in November.
A survey of this kind records worries, not probabilities. The report calls them “potential near-term risks”, and it is careful to separate shocks, which are hard to predict, from vulnerabilities, which can be watched as they build.
What is not known
The latest comprehensive hedge fund data in the report covers the first quarter of 2026. The Fed’s dealer survey says leverage was roughly unchanged in the second and third quarters. So the record is a few months old, and whatever has changed in November is not yet visible. The Fed’s next report will show whether leverage rose or fell through this period of rising yields.
Sources
More in Markets
-
The Dollar Climbs to a 19-Month High: Yen Near 160, Euro Near $1.10, Yuan Hardly Moving
Fed data show the dollar gaining on the yen, euro, pound and Canadian dollar in one week, while the yuan stayed almost flat. Rate-hike bets are the common thread.
-
Gold Falls to a One-Year Low as Rate-Hike Bets Build, Heading for Its Worst Year Since 2015
Spot gold touched $3,830 on 16 November, 31.5% below January's record. An inflation shock that usually helps gold is instead pushing yields and the dollar up.
-
Copper Keeps Its Price While Aluminium Gives Back Its War Premium
Standard Chartered says aluminium has erased its Middle East risk premium, yet copper stays high on tight Asian stocks and a US tariff review.