Gold Falls to a One-Year Low as Rate-Hike Bets Build, Heading for Its Worst Year Since 2015
Spot gold touched $3,830 on 16 November, 31.5% below January's record. An inflation shock that usually helps gold is instead pushing yields and the dollar up.
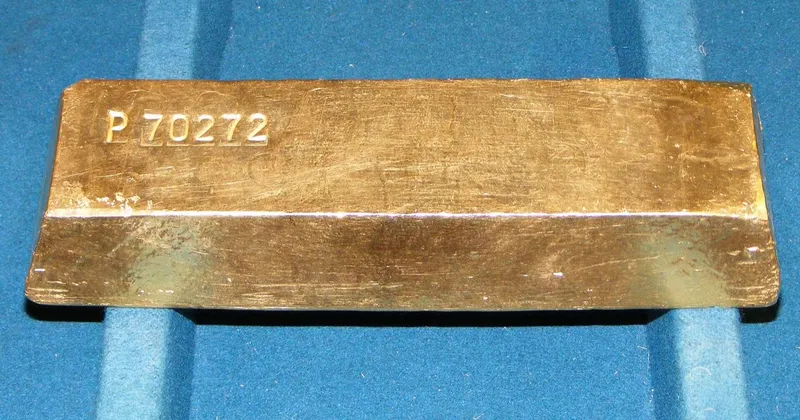
Gold is behaving the opposite way from what a year of war and rising prices would suggest. Spot gold fell to $3,830.74 an ounce on Monday 16 November, its lowest since 2 October 2025, according to a Reuters report carried by Kitco. That is 31.5% below the record of $5,594.82 set in January, and the metal is on track for its worst calendar year since 2015.
Why an inflation scare is hurting gold
Gold is often described as an inflation hedge, and the United States and Israel’s war with Iran, which began in late February, has pushed up oil and inflation expectations. But the Reuters reports tie gold’s slide to the reaction by central banks and bond markets, not to inflation itself.
Gold pays no interest. When yields on Treasury bonds rise, the cost of holding it rises with them. The Treasury’s own data show how fast that has moved this month. The 2-year yield was 4.46% on 5 November and 4.88% on 13 November, and the 10-year went from 4.84% to 5.15% over the same days. On the 16th, the 10-year was at 5.12%.
Behind the yields is a bet on the Federal Reserve. Reuters, citing the CME’s FedWatch tool, said on 13 November that markets saw an 89.4% chance of a 25-basis-point rate hike in December, down from 96.2% before the producer price report that morning, and a 10.6% chance of a 50-point hike. By 16 November Reuters described traders as expecting a quarter-point rise with a small chance of a half-point. The dollar, meanwhile, was hovering near its highest since April 2025, which makes a dollar-priced metal more expensive for buyers in other currencies.
A week and a day of losses
The slide came in two steps:
- On 12 November gold fell 3% to a more-than-one-year low, as Reuters put it on the 13th.
- By Friday 13 November spot gold was near $3,899 and on course for a weekly drop of more than 4%, the worst week since early June, after a session high of $3,922.97.
- Silver, platinum and palladium were also on course for weekly losses that Friday. Silver was at $49.91, platinum at $1,512.03 and palladium at $1,014.74.
Independent analyst Tai Wong told Reuters that it had been a tough week for gold, “which may struggle to retake 4,000 with Fed hawks out in force.” Nikos Tzabouras of FXCM said the market’s expectation of higher interest rates boosts the dollar and compounds gold’s headwinds.
Nicky Shiels of MKS PAMP offered a different framing of why gold fell alongside stocks. In the short term, she said, gold is a “liquidity asset”, the thing investors sell to raise cash. Reuters noted that Nvidia’s market value had fallen by $1.9 trillion since early October to $3.9 trillion by Friday. If funds are covering losses elsewhere, gold can be sold even when its own story is unchanged.
What the buyers did
The people who hold gold for long periods were not selling. Reuters reports that physically backed gold ETFs took in 211 metric tons in the third quarter, even with yields and the dollar rising. Demand for bars and coins fell sharply. Central banks bought 675 tons in the first nine months of the year, according to estimates from the World Gold Council, and China’s central bank has been buying for two years.
One buyer may be about to step back. Reuters says Poland, the most active official buyer, likely stopped purchases in November after reaching its target of 700 tons. The report does not give a view on what that does to demand, and a single central bank’s pause is not a trend.
What the numbers do and do not say
Three limits are worth stating.
First, $3,800 per ounce is being watched as a psychological level, according to analysts quoted by Reuters, and gold had so far held above it. That is a trader’s rule of thumb, not a floor.
Second, nothing in these reports shows the cause of the gold decline with certainty. They offer several explanations, including yields, the dollar, rate expectations and forced selling, which tend to move together. Disentangling them is hard even for specialists.
Third, a fall of nearly a third from a January peak does not by itself say whether the earlier price or the present one is the outlier. Gold stood at $5,594.82 only ten months ago. Whatever the metal does next, the lesson of the past ten months is that an asset sold as protection against inflation can lose value when the response to inflation is higher interest rates.
For readers following the metal, the figures that Reuters keeps returning to are the ones above: the odds of a December hike, the 10-year yield and the dollar.
Sources
- Reuters via Kitco: Gold sinks to 1-year low as Treasury yields and dollar bite, set for worst year since 2015 (16 November 2026) kitco.com
- Reuters via Kitco: Rate hike bets keep gold on track for its worst week in four months (13 November 2026) kitco.com
- U.S. Department of the Treasury: Daily Treasury Par Yield Curve Rates, November 2026 home.treasury.gov
More in Markets
-
The Dollar Climbs to a 19-Month High: Yen Near 160, Euro Near $1.10, Yuan Hardly Moving
Fed data show the dollar gaining on the yen, euro, pound and Canadian dollar in one week, while the yuan stayed almost flat. Rate-hike bets are the common thread.
-
Fed Stability Report: Hedge Fund Leverage at a Record, Term Premiums Up, and Yields Higher Since
The Fed's November Financial Stability Report uses data to 28 October. Treasury yields have moved further since, and hedge fund leverage is the highest on record.
-
Copper Keeps Its Price While Aluminium Gives Back Its War Premium
Standard Chartered says aluminium has erased its Middle East risk premium, yet copper stays high on tight Asian stocks and a US tariff review.